

[ad_1]
Do you know what social media success looks like for your business?
Like most areas of marketing, results vary based on industry, target audience, and the ability to create content that attracts customers.
Rival IQ released its annual Social Media Benchmark Report for 2023, where brands in 14 industries compare their social media performance against other brands in the same competitive landscape.
The data set covers social media engagement on Facebook, Instagram, TikTok, and Twitter for 2,100 companies across numerous industries, ranging from food & beverage to tech.
The Facebook following of the companies analyzed ranges from 25,000 – 1,000,0000, and all have over 5,000 followers on Instagram, TikTok, and Twitter.
The following are the top insights marketing professionals need to know.
Overall Engagement
Between 2019-2022 all industries have seen a drop in overall engagement on Facebook, Instagram, and Twitter.
Facebook and Twitter only showed a slight change in engagement.
For Facebook, it dropped to 0.06% in 2021, maintaining that rate the following year. For Twitter, it dropped 0.01% between 2019-2022.
Weekly posting over time for both networks has fallen from 5.8 to 5 posts per week on Facebook and 5.4 to 3.9 posts per week on Twitter.
On the other hand, Instagram saw a much larger drop, from 1.22% to 0.47%. But unlike Facebook and Twitter, weekly posting on this platform has increased from 4.3 to 4.5 posts per week.
Facebook Engagement
Across all industries, Facebook’s median engagement rate per post by followers is 0.06%.
The median number of weekly posts across all industries is 5.04, with media posting the most at 73.5 times weekly. This is likely because media companies publish more news content than brands in other industries.
Instagram Engagement
Across all industries, Instagram’s median engagement rate per post by followers is 0.47%.
The median number of weekly posts across all industries is 4.6, with sports teams posting the most at 15.6 times weekly.
TikTok Engagement
Across all industries, TikTok’s median engagement rate per post by followers is 5.69%.
The median number of videos per week across all industries is 1.75, with media posting the most at 4.2 times weekly.
Twitter Engagement
Across all industries, Twitter’s median engagement rate per post by followers is 0.035%.
The median number of weekly tweets across all industries is 3.91, with media tweeting the most at 70.2 times weekly.
Top Post Types
The best types of posts on each social network vary by industry.
Photo and video posts drive the most engagement on Facebook, while link and status posts have the least.
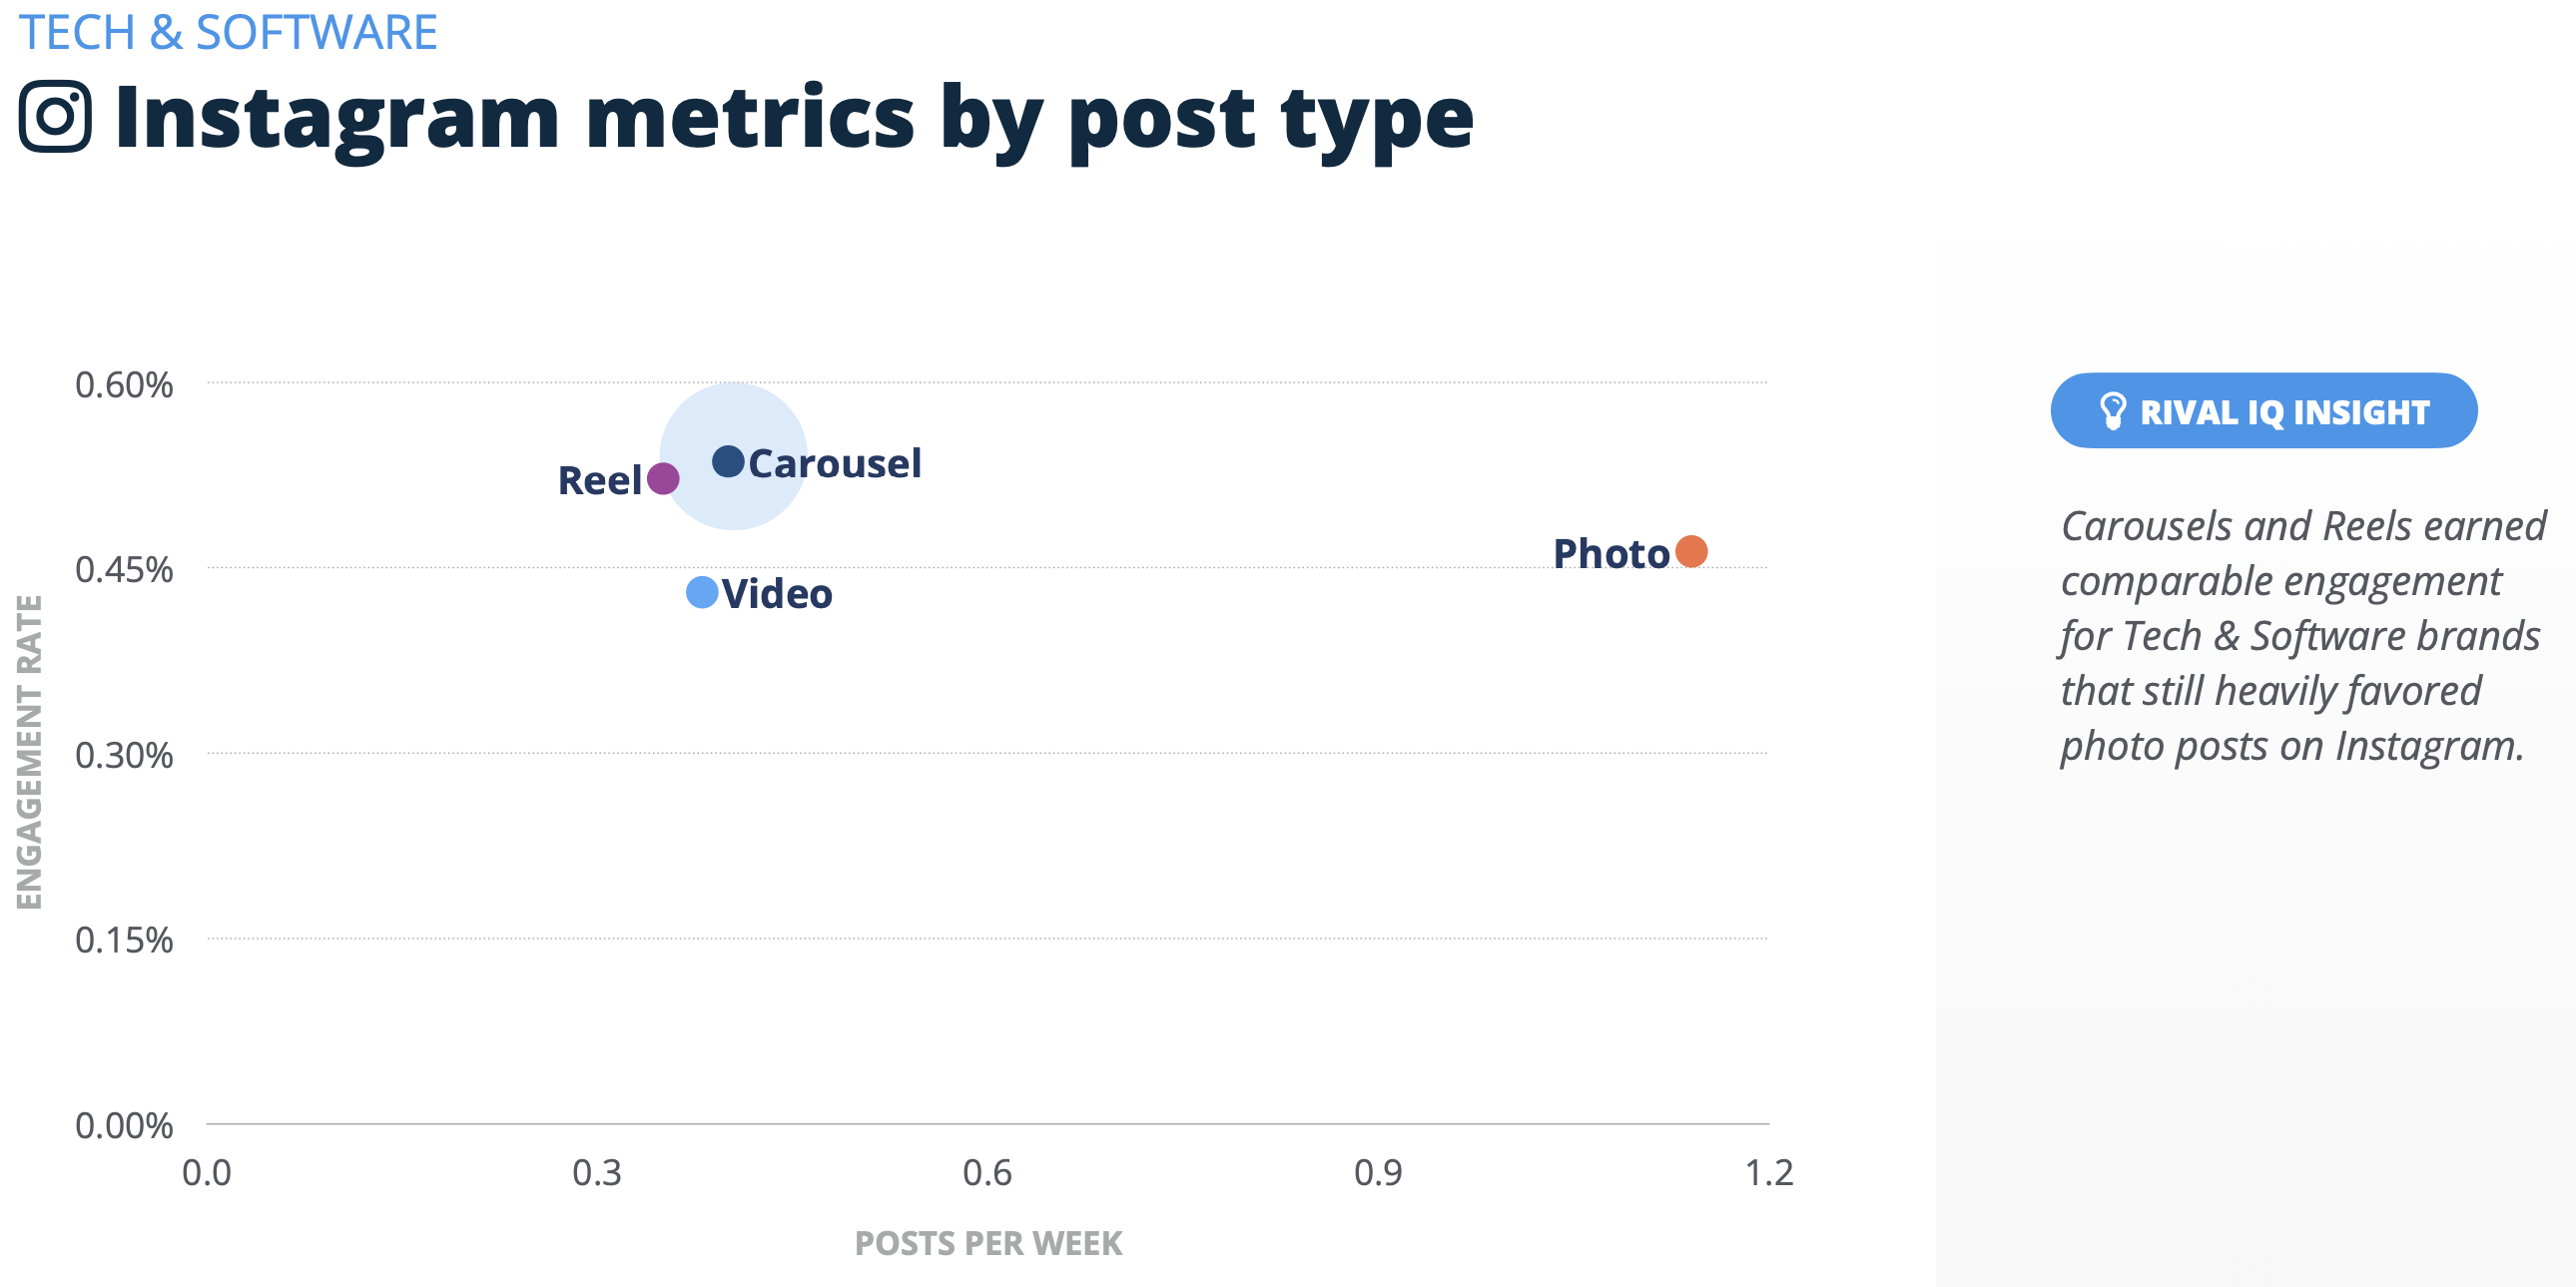 Screenshot from Rival IQ, March 2023
For Instagram, the data indicates that businesses should focus content creation efforts on Reels, carousels, and photos. Video posts not uploaded as Reels tend to have the least engagement.
On Twitter, posts with photos, videos, and statuses show the most engagement, while Tweets with links tend to have the least.
Top Hashtags
Hashtags vary significantly across industries and platforms. Holiday hashtags tend to generate the most engagement across all industries, while contests and giveaways have dropped in popularity compared to previous years.
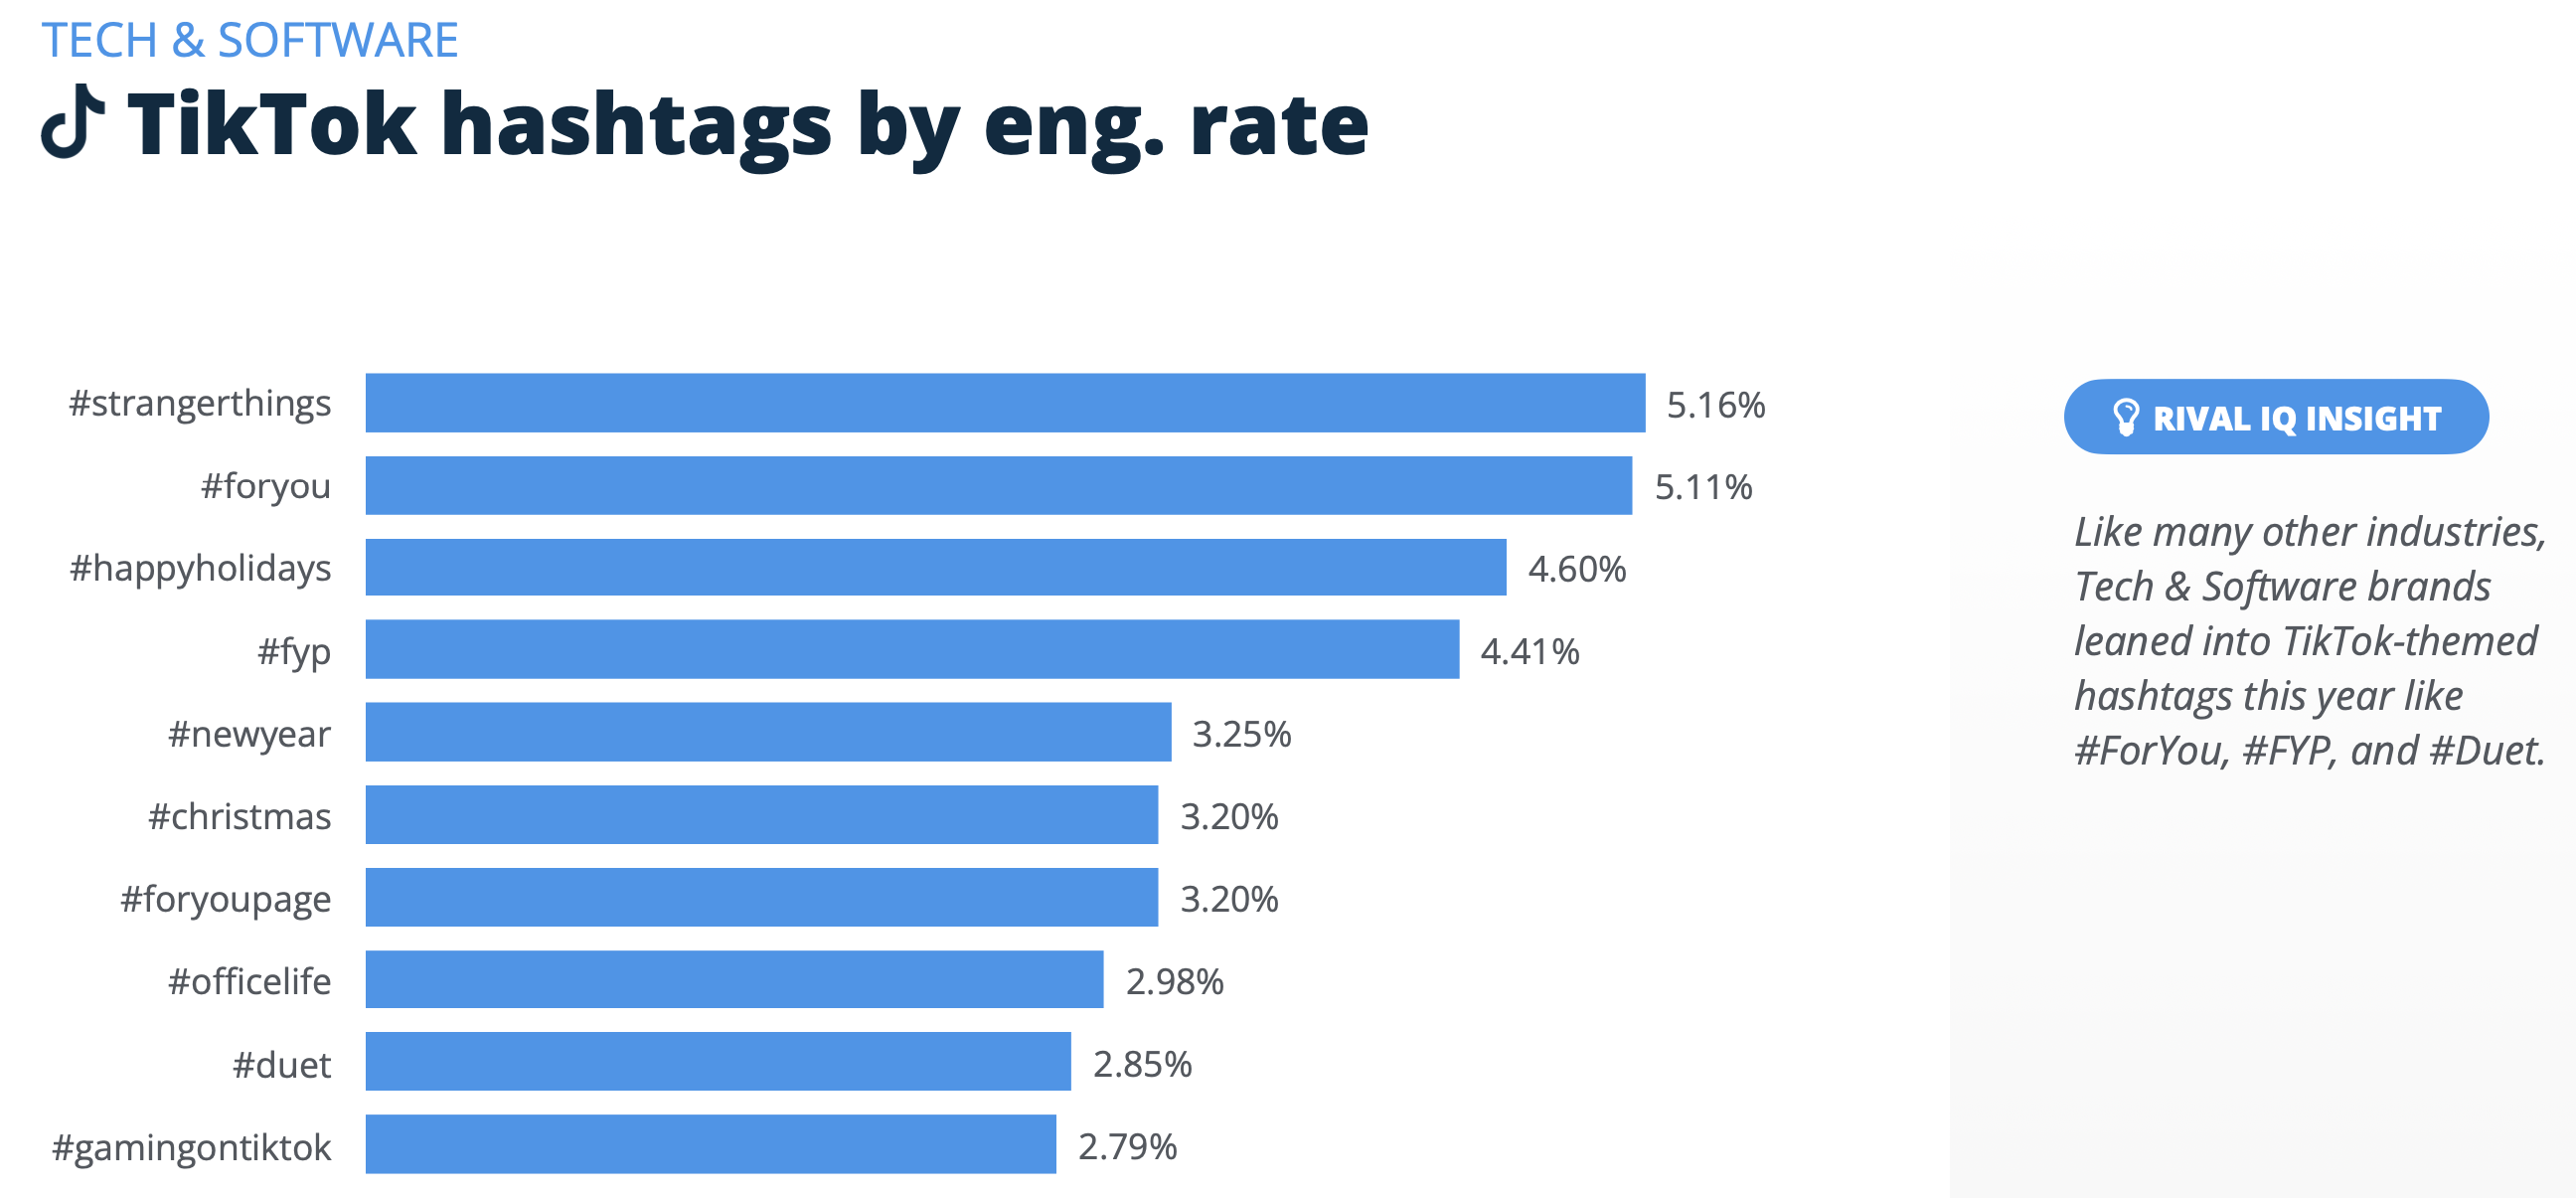 Screenshot from Rival IQ, March 2023
Key Takeaways
The key takeaway is that each industry’s audience is slightly different. While food & beverage brands see the best engagement with Instagram Reels, higher education brands see the best engagement with Instagram carousels.
To get the most out of your social media strategy, find ways to transform your content into the format that gets the best engagement on each of the top social networks. This will ensure you reach the most potential customers with the content they enjoy consuming.
For 100+ pages of industry-specific insights, visit Rival IQ and download the 2023 Social Media Bookmark Report.
Featured Image: 13_Phunkod/Shutterstock
Source link
[ad_2]


0 Comments